Visual Analyser shows its analysis in a form of visual diagrams as described in detail in Visual Analysis Concept
The screen has the following interface elements:
Screen header
On the top of screen there is a screen header with many columns. Each column represents a single lottery draw.
![]()
Those columns show a lottery draw position from oldest to newest within the analysis range. You can analyze from example last 100 draws and here the same number of columns is shown. You can move mouse over the header and see the tip with the draw position number and date.
If you click on any column, then selected draw will be shown on the main Ticket View
Because of the limited space in columns to show a whole drawing position number, we show only last digit, the full drawing info is show on an information bar instead.
When you perform some analysis selected from Visual Analyser menu then this screen will show analysis diagrams.
Here we describe diagram element and its analysis types.
Diagram Elements
Here a sample picture of one of diagrams:
Diagram has a title that shows; analyzed group name or description of analyzed numbers etc.
In our example picture below the title is in blue and shows Contact, which means that this diagram shows analysis of the Contact numbers in general.
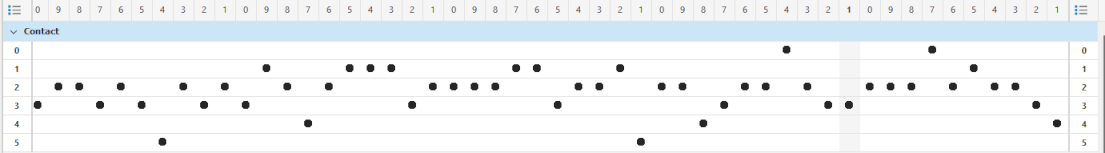
Below the diagram title is the area when single draw analysis result is shown, each drawing analysis result is a black dot.
Each diagram can show hundreds of analyzed lottery drawings at once, how many you can set in the lottery options.
Lottery draws are shown in order from the latest to the last, from the left to the right side of a diagram.
The last lottery draw is always on the right side of the screen.
On the left and right side of diagram you can see row enumeration legends, those legends are identical.
They show the diagram row number, from 0 to maximum numbers occurrences.
Some diagrams have only two rows, and in that case the legend will show 0 and +.
How to interpret the diagram is described in Visual Analysis Concept topic.
Not all diagrams may be visible at once on your screen, that depends on your screen resolution.
To see more diagrams on screen you use vertical scroll bar or F7 key. topic.
To scroll and see more of the past analyzed lottery drawings use the horizontal scroll bar or buttons described in Visual Analyser window topic.
Diagram Types
Visual Analyser analyzes numbers in their every possible combination with each other.
Just to remind you, each special number type can be drawn as a single typed number or in combination with other types.
Please see the Analysis Base topic for more info on it.
For example, if you choose from the analyzer menu Types of Numbers > Occurrences of Contact numbers then you will see couple of diagrams:
First diagram always will show the analysis of master number in its title
1.Contact
First diagram shows analysis of numbers as they occurred as Contact number only
2.Contact & Hot
the next diagram shows the numbers that were drawn as Contact and Hot number together.
3.Contact & Cold
the next diagram shows the numbers that were drawn as Contact and Cold number together.
4.Contact & Even
the next diagram shows the numbers that were drawn as Contact and Even number together.
5.Contact & Odd
the next diagram shows the numbers that were drawn as Contact and Odd number together.
6.Contact & Connected
the next diagram shows the numbers that were drawn as Contact and Connected number together.
7.Contact & Unconnected
the next diagram shows the numbers that were drawn as Contact and Unconnected number together.
8.Contact & Disconnected
the last diagram shows the numbers that were drawn as Contact and Disconnected number together.
When comes to analyzing game layout the diagrams show first, game layout type description, game layout number and then number type.
For example, if you select from the analyzer menu Lines > Horizontal Lines > Line 1 then you will see couple of diagrams:
The diagrams show the numbers analysis that were drawn in a horizontal line 1
1.Horizontal Line 1 - All Types
First diagram shows analysis of numbers as they were drawn as is.
2.Horizontal Line 1 - Contact
were drawn as Contact number.
3.Horizontal Line 1 - Outside
were drawn as Outside number
4.Horizontal Line 1 - Hot
were drawn as Hot number.
5.Horizontal Line 1 - Cold
were drawn as Cold number.
6.Horizontal Line 1 - Even
were drawn as Even number.
7.Horizontal Line 1 - Odd
were drawn as Odd number.
8.Horizontal Line 1 - Connected
were drawn as Connected number.
9.Horizontal Line 1 - Unconnected
were drawn as Unconnected number.
10.Horizontal Line 1 - Contact & Disconnected
were drawn as Disconnected number.
For more information on how to interpret the diagram results please see Visual Analysis Concept topic.
Numbers Guide
When you click on a diagram title column or any row then Visual Analyser can show you visually on the main Ticket View all numbers from selected diagram.
If main Ticket View shows game layout in 1x mode then you can see the all the numbers that were analyzed otherwise as they were drawn.