Visual Lottery analysis involves using data visualization techniques to analyze lottery data and gain insights into patterns, trends, and probabilities related to lottery numbers and outcomes.
Visual Lottery Analyser introduces a new revolutionary approach to analyze lottery games.
A visual presentation of numbers!
One peek at a diagram gives you much more information than many lines of lottery numbers. Diagrams let you analyze lottery games with greater speed and better understanding.
You can see the numbers pattern and make a prediction of how the numbers may probably occur in the future.
The Old Way - Example 1
Let's try to analyze number 1 and number 2, how often these numbers have been drawn in the past lottery drawings?
If not been drawn then we can write 0, if yes then we can write 1, in the result we receive:
Number 1: 0,0,1,1,0,1,0,0,0,0,0,1,0,0,1
Number 2: 0,1,1,0,1,0,0,0,0,0,0,0,1,1,0
All that above is not very readable, do you agree?. And how fast you can draw some conclusion based on such bunch of numbers?
The New Way - Example 1
Here below is a screenshot of Visual Analyser's window (just a small part of it) with analysis of some game numbers.
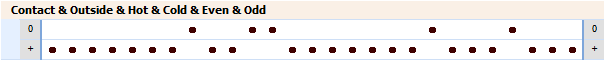
This is a graphical diagram. How to read it? You may have already realized that.
![]()
When analyzed number is not drawn them the black point is shown in a row (0)
When analyzed number has been drawn them the black point is shown in a row (+)
Simple, now you see series of analyzed numbers as a wave of points, each point represents single number occurrence.
The Old Way - Example 2
The diagram above shows you only a simple fact, a number occurred or not.
Let's try to analyze some group of game numbers, how often the numbers have been drawn from some group of numbers in the past lottery drawings?.
If numbers were not drawn then we write 0, if yes then we write the quantity of drawn number, so we receive note like that:
0,2,1,1,0,1,0,0,0,3,0,1,0,0,1
Also, such string of numbers does not say much and is hard to make any fast prediction.
The New Way - Example 2
Here below is a screenshot of Visual Analyser window (just a small part of it) with results of analysis of numbers from horizontal line 1.
For example, analyzed line is the first horizontal line of a game.
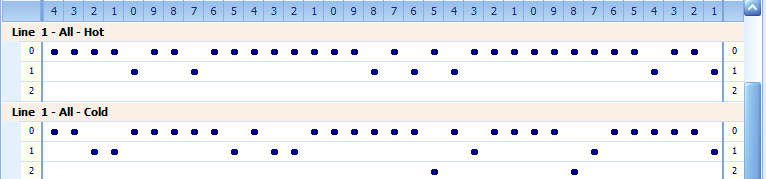
How to read the diagram above?
When no number is drawn from analyzed group of numbers then the point is shown in a row (0)
When one number is drawn from analyzed group of numbers then the point is shown in a row (1)
When two numbers are drawn from analyzed group of numbers then the point is shown in a row (2) etc.
How to interpret the diagram
When you looking at the diagram, look from the diagram left to its right side. The last lottery draw is on the right side.
Now getting back to our sample analysis of occurrences of numbers in the first horizontal line.
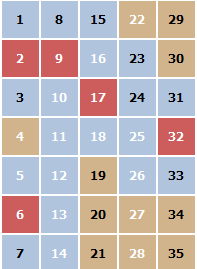
In our example the horizontal Line 1 has the following numbers: 1,8,15,22,29. See the Ticket View picture, numbers of the line circled in green
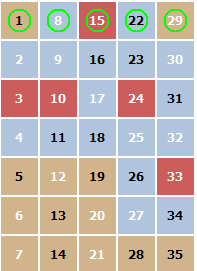
Now look at the diagram above. The diagram shows that only one number is maximally drawn from analyzed group of numbers
That means that from time to time only one number either 1 or 8 or 15 or 22 or 29 is drawn.
It also means that at the present time, there are no 2 numbers drawn from this line at all. Not to mention 3 or more numbers.
Therefore, if you are buying lottery ticket, which contains 3 numbers from that line, certainly your chances to hit the jackpot are lost.
How to predict what would happen in the future lottery draw?
We would bet that the point would be placed at the row (0), no numbers will be drawn from that line at all.
The point at the row (1) appears occasionally and is like never repeating after one occurrence.
So, there is high chance that any of these numbers 1,8,15,22,29 will be drawn in the next, future lottery draw.
More diagram interpretations
Not always situation is clear as in example above. Everything depends on the game layout, how many game numbers are drawn. Everything changes from lottery draw to lottery draw.
How to interpret the diagram and draw some logical conclusion when diagram looks like that:
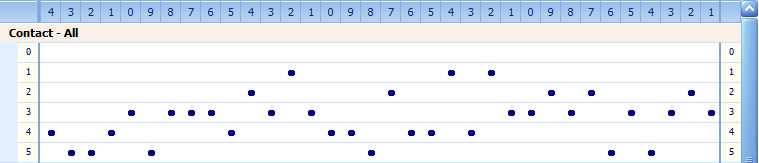
Above is a screenshot of Visual Analyser window (just a small part of it) with results of analysis of occurrences of Contact numbers in a game.
First let's look at our sample Ticket View picture, especially the Contact numbers, because we are analyzing them in this sample.
There are plenty of contact numbers colorized in blue color. Now let's interpret the diagram above.
First, what we can see immediately is that all past lottery drawings always include some of the Contact numbers. In the diagram above we do not see any points in row (0)/
So, we cannot ignore this fact, and in our ticket we must include some of Contact numbers.
If you are going to buy lottery ticket that does not include any of Contact numbers or you got a ticket with number like
(4,19,22,30,35 - all Outside numbers as you may see in the example picture) you are losing all the chances to hit the jackpot.
Summary
Using diagrams, you can analyze all kinds of numbers, lines, blocks and group of numbers that are available to analyze in Visual Lottery Analyser.
You can analyze any type of game numbers separately and in any combination of them. To see that all, you just must run the software and see it yourself.
Visual Analyser does have a lot of analyzing methods, each including few diagrams.
In overall there are hundreds of diagrams to go through. You, however, can use only a several of them, it is up to you.
If you go through all of them, you can have the general picture of the future lottery draw, which numbers most likely can be drawn and which rather not.
For better tracking of your conclusions when you analyze those diagrams you can use built-in My Choices tool
It may be a very time-consuming task to use this feature to choose the numbers.
Nowadays we do not have too much time to do all of this, but do not forget that Visual Lottery Analyser is computer software and as such it will do the entire job for you in seconds.
You can use One Step Analysis or Tickets Advanced to create numbers that will match analysis criteria, fast and easy.